Operations Dashboards for Professional-Services Firms
Your numbers live in six tools. The Friday roll-up disagrees with them by Monday. We build the reporting layer that pulls from your CRM, accounting, project, and time-tracking tools, then shows utilization, margin, AR aging, and project health in one live view. No more Friday Excel days. Certified n8n Expert Partner. 5.0 from 7 reviews.
Why Friday Excel days happen
Live aggregation, scheduled delivery
The dashboards we build
Six common dashboards for a services firm. Most clients install three or four in the first 28 days.
-

Utilization and capacity
Billable utilization by person, team, and service line. Capacity forecast 4 to 8 weeks out. Surface an overcommitted resource before the project lead has to escalate. Tied to your time tracker and project tool.
-

Margin and project health
Per-project gross margin, hours burned vs budget, and scope-creep flags. Pulls deal value from the CRM, cost from time tracking, and status from the project tool. PMs see margin without doing accounting.
-

AR aging and cash
Live AR aging by client, days-sales-outstanding trend, and a chase-priority queue. Pulled from QuickBooks, Xero, or NetSuite. The cash talk moves from 'let me run a report' to 'here is the screen'.
-

Sales pipeline and forecast
Pipeline by stage, weighted forecast vs quota, and stuck-deal alerts. Stage-hygiene flags surface deals that have not moved. Forecast accuracy climbs because reps stop getting asked for the same number three times a week.
-
SLA and ticket health
First-response time, resolution time, backlog age, and SLA breach alerts. Pulls from Zendesk, Intercom, or Front. Support leads see hotspots before they become escalations.
-
Weekly report packs
Annotated PDF or HTML packs that build Thursday afternoon and land Friday morning. Last week's numbers, this week's changes, anomalies flagged inline. Nobody builds slides.
How the data layer works
Four phases. Each phase delivers a usable dashboard before the next one starts.
- 1
Phase 1. Source connection
Connect each tool, HubSpot, QuickBooks, ClickUp, Harvest, Stripe, or your database, through native APIs. Connections are monitored and error-recovering.
- 2
Phase 2. Transformation
Set your metric definitions in one place: what counts as billable, how margin is figured, when a deal is won. Numbers agree because every dashboard reads the same source.
- 3
Phase 3. Dashboard build
Build in Looker, Metabase, Sigma, or custom. Each dashboard is documented, tested with real users, and tuned for the question it answers.
- 4
Phase 4. Delivery and alerts
Live dashboards live where your team works. Report packs deliver on a cadence. Anomaly alerts fire on an off-trend number, so leadership reads exceptions, not noise.
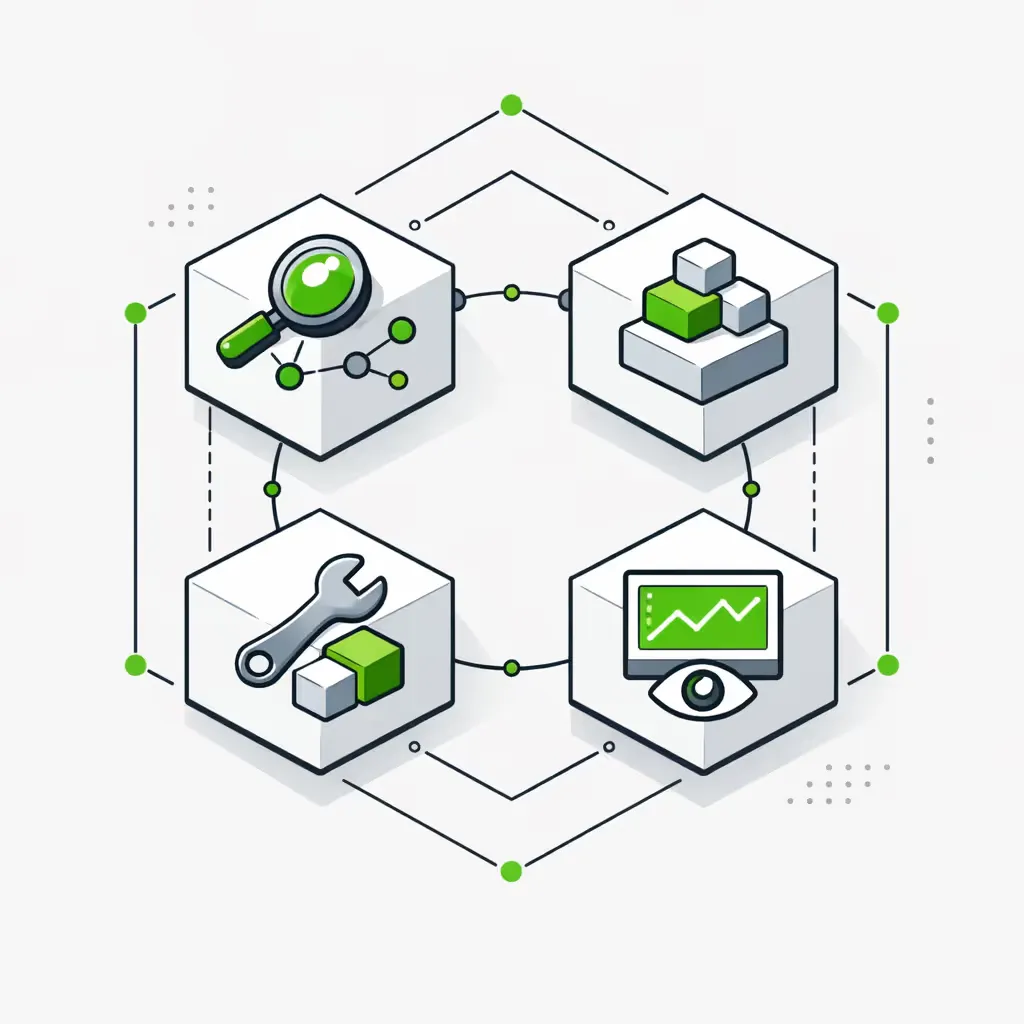
Looker, Metabase, Sigma, or custom
-
OFF-THE-SHELF BI
Best when you have a data team to own dashboards long-term. Looker fits Google-stack shops; Metabase wins on self-host and lean teams; Sigma fits finance-heavy Snowflake shops. We build inside whichever tool you pick. -
CUSTOM DASHBOARDS
Best when off-the-shelf BI is overkill or under-fit: a client-facing view with your branding, or an ops screen on a TV in the bullpen. We build with React or your app stack. -
AUTO-EMAILED REPORT PACKS
Best when the audience will not log into a tool. Founders, board members, and clients read a Thursday PDF but never open Metabase.
Real outcomes, Contrail Financial install
Outcomes after the reporting layer goes live
| Metric | Before | After | Improvement |
|---|---|---|---|
| Metric Time to weekly report pack | Before 1-2 days/week | After 0 (automated) | Improvement Direct |
| Metric Days to month-close | Before 4-6 days | After 1-2 days | Improvement -70% |
| Metric Annual cost savings (Contrail) | Before $0 | After about $54K/year | Improvement Direct |
| Metric 'Show me utilization' lag | Before 20-60 min | After Live dashboard | Improvement Instant |
Stack
The tools we connect to
We have worked with 137 tools in production. If yours has an API, we can connect it.
The Backbone
The Reporting and Dashboards Module
The full reporting layer we install for a services firm. It pairs with our <a href="/systems/quote-to-cash-automation/">quote-to-cash</a> system and <a href="/systems/invoice-automation/">invoice and AR automation</a>, and rolls up into the <a href="/solutions/operations-automation/">operations automation</a> pillar.
Reporting and Dashboards Module
The complete data and reporting layer for operations leadership:
Source Integration
Native API connections to every operational tool, CRM, accounting, project, time tracking, helpdesk, payments. Monitored and error-recovering.
Transformation
Metric definitions codified once. Utilization, margin, deal-won, AR aging, all defined in one place and read from the same source.
Dashboard Build
Production dashboards in Looker, Metabase, Sigma, or custom. Documented, tested with real users, and tuned to the question they answer.
Report Pack Automation
Weekly or monthly PDF or HTML packs that build and deliver to Slack, email, or portal. Annotated with anomaly flags inline.
Anomaly Alerts
Slack and email alerts when a number goes off-trend, utilization drops, AR spikes, deals stall. Leadership reads exceptions, not noise.
Custom Metrics Layer
When the off-the-shelf metric is not quite right, effective rate by service line, contribution margin including indirect cost, retention-adjusted ARR, we model and instrument the custom version, then surface it across every dashboard that needs it.
Margin and Forecast Models
Beyond reporting what happened, we model what is likely to happen. Pipeline-weighted revenue forecast, utilization forecast, AR collection forecast, project margin at-completion projections. Built with your finance lead, not in a vacuum.
Engagement and pricing
We start with a paid workshop, then install the Foundation reporting layer in 28 days, then keep it running on a monthly retainer. Each phase delivers a usable dashboard before you commit to the next.
If we cannot show ROI inside six months, we do not take the project.
- Discovery workshop: $2K. Map the metrics your leadership uses, audit the data sources, prioritize the 28-day build.
- Foundation reporting build: $7K-$13K. Source connections, transformation layer, first 2-3 dashboards, and a scheduled report pack.
- Ongoing Expansion retainer: from $1K/month for monitoring and small fixes; $3.5K/month for active dashboard expansion; $6.5K/month for embedded analytics engineering.
Operations Dashboard FAQs
If you have a question, chances are you'll find the answer below.
Looker, Metabase, or Sigma, which do you recommend?
It depends on the team. Metabase is the low-friction self-host pick for lean ops teams. Looker fits Google-stack shops on BigQuery. Sigma fits finance-heavy Snowflake shops. Not sure? We start on Metabase and revisit at 90 days.
Do we need a data warehouse?
Not for most operational dashboards. Under about 100K records, we pull live from source APIs and cache hard. Past millions of rows or years of history, a warehouse like BigQuery, Postgres, or Snowflake pays back. We tell you which side you are on.
How real-time is real-time?
For most metrics, a 5 to 15 minute refresh matches the decision cadence. For SLA and pipeline alerts where minutes count, we push events through webhooks, so updates land within seconds.
Can it forecast, or just report?
Both. Reporting is the base. Forecasting layers on once the data is clean. We build pipeline-weighted revenue forecasts, utilization forecasts, and project margin at completion. Forecast quality tracks your CRM and time-tracking discipline.
Will it conflict with our current dashboards?
No. We read from the same sources. Teams often retire the stale dashboards within 90 days because the new ones earn trust. That is your call, not a forced migration.
What does the team need to run it?
Metric definitions live in a layer your analysts can edit. Visuals live in the BI tool your team can edit. We document what is safe to change and what needs an engineering review.
Get started
Start with your Efficiency Scorecard
The Efficiency Scorecard maps which metrics your leadership decides on and where the data is trapped today. Run the math with our ROI calculator and workflow cost calculator. The reporting layer pairs with our quote-to-cash system and invoice and AR automation. For the vertical view, see our professional services build. See the Contrail Financial case for real outcomes.